2 minutes
Data Painting - The Past in Realtime
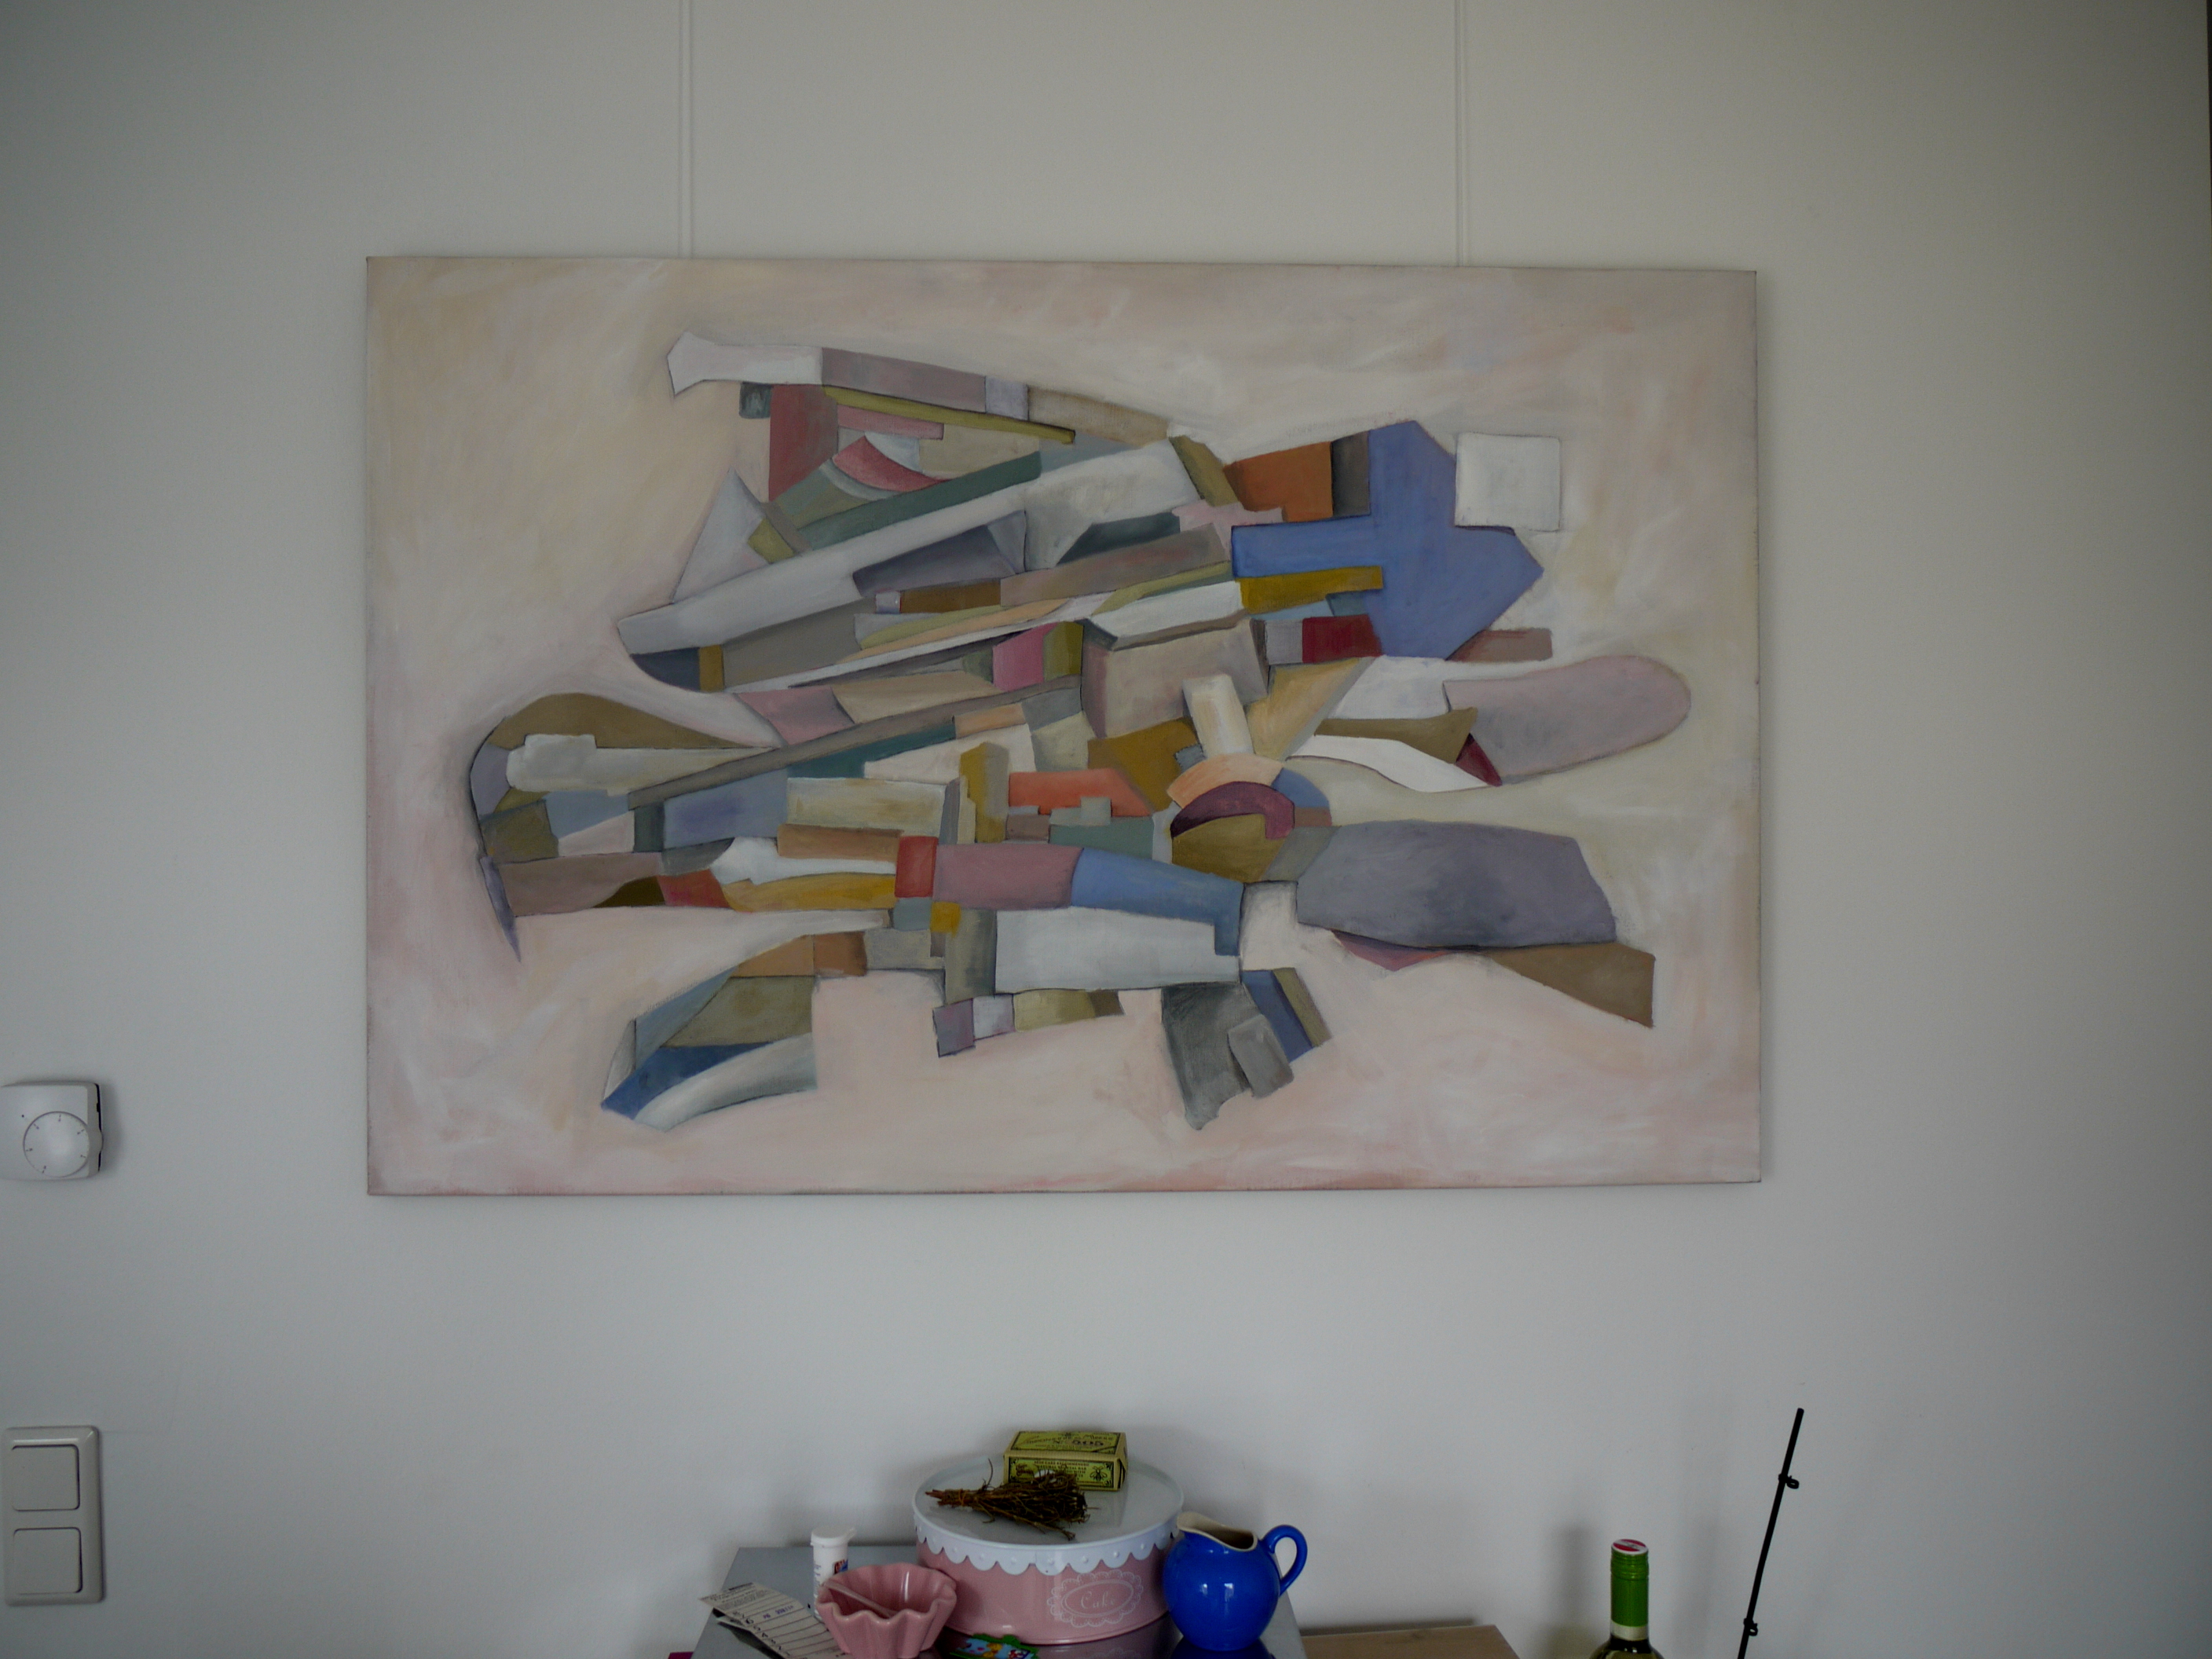
After the infamous projection prototype, my first work is finished: the past in realtime. It displays our team’s diverging efforts for each minute of the day on a painted canvas. Based on the data of 51.000 time entries of ambuzzador’s past, the painting explains the distribution of our working time for six categories: project management, meetings, conceptual design, consulting, editorial services and content creation. For each minute, six color tones are projected on variably sized, painted areas. For instance, the amount of the screen the blue color fills is the proportion of the work spent on meetings at that time. In short: A pie chart without a pie.
How it was done
I took the timesheets, which hold the exact date and time when a particular task was started and ended - about 51.000 eintries since 2011. When expanding the time entries for every minute ranging from the minute started and the minute ended the data grew to about 21 billion entries.
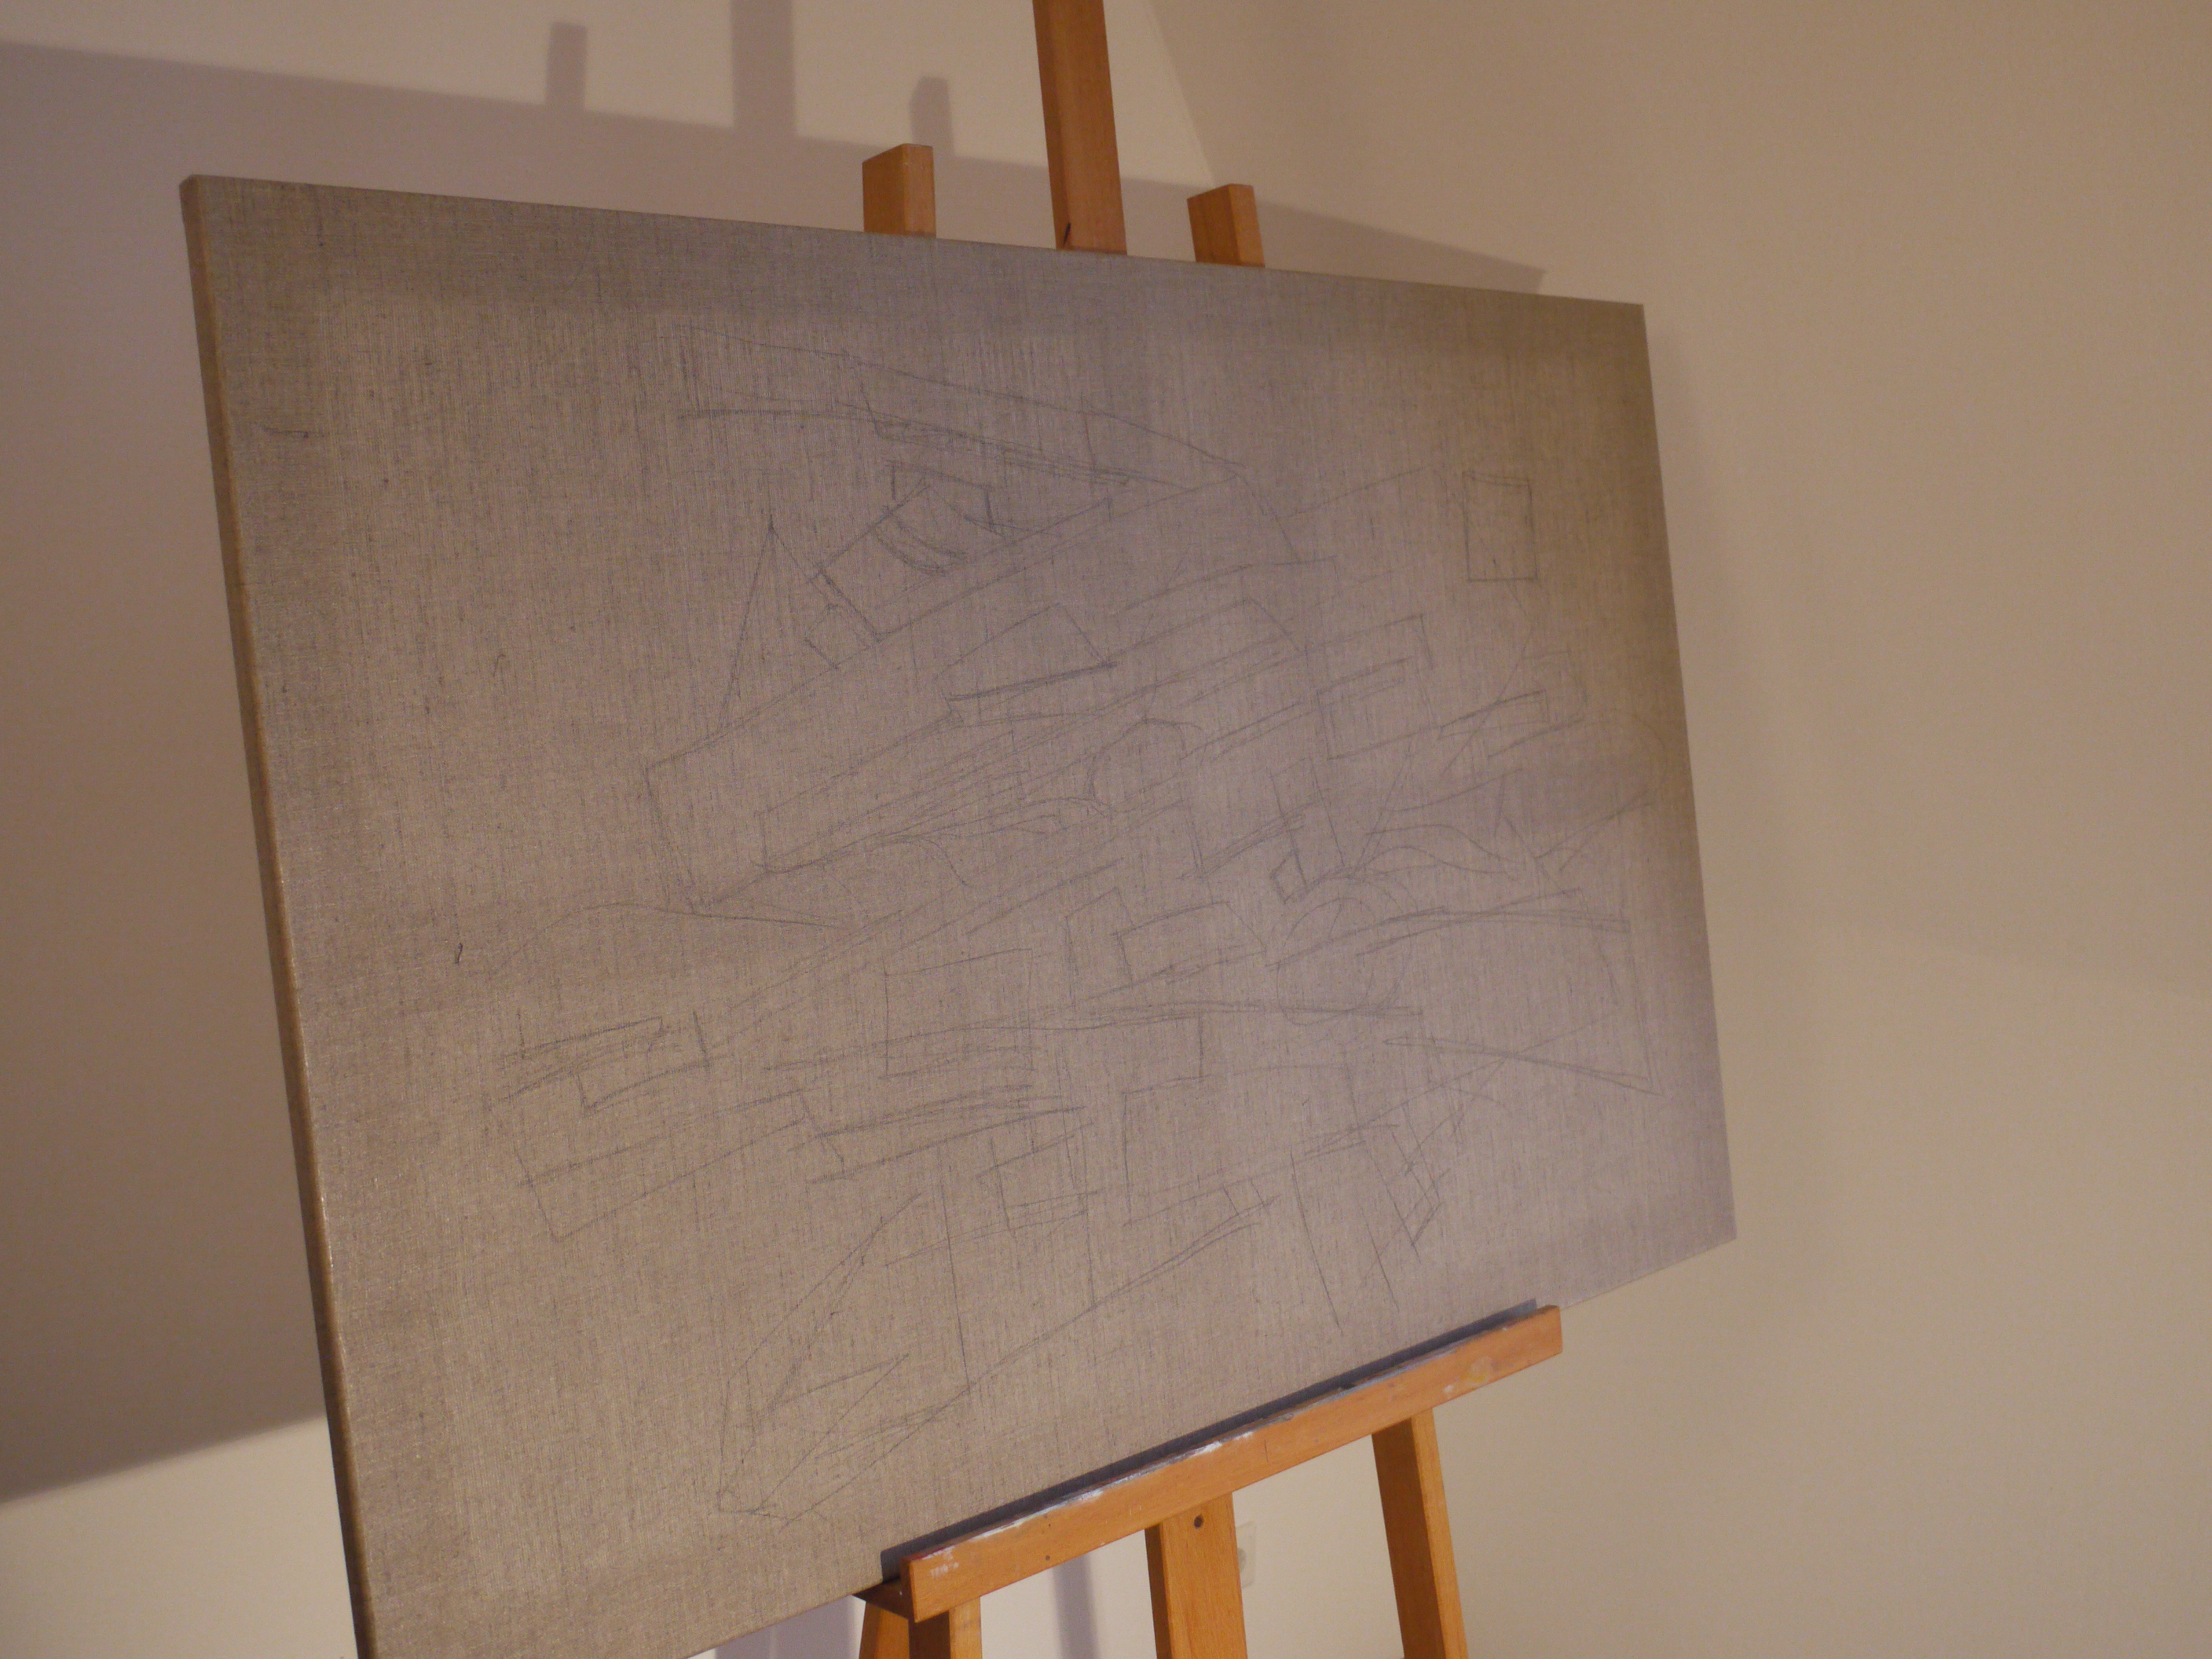
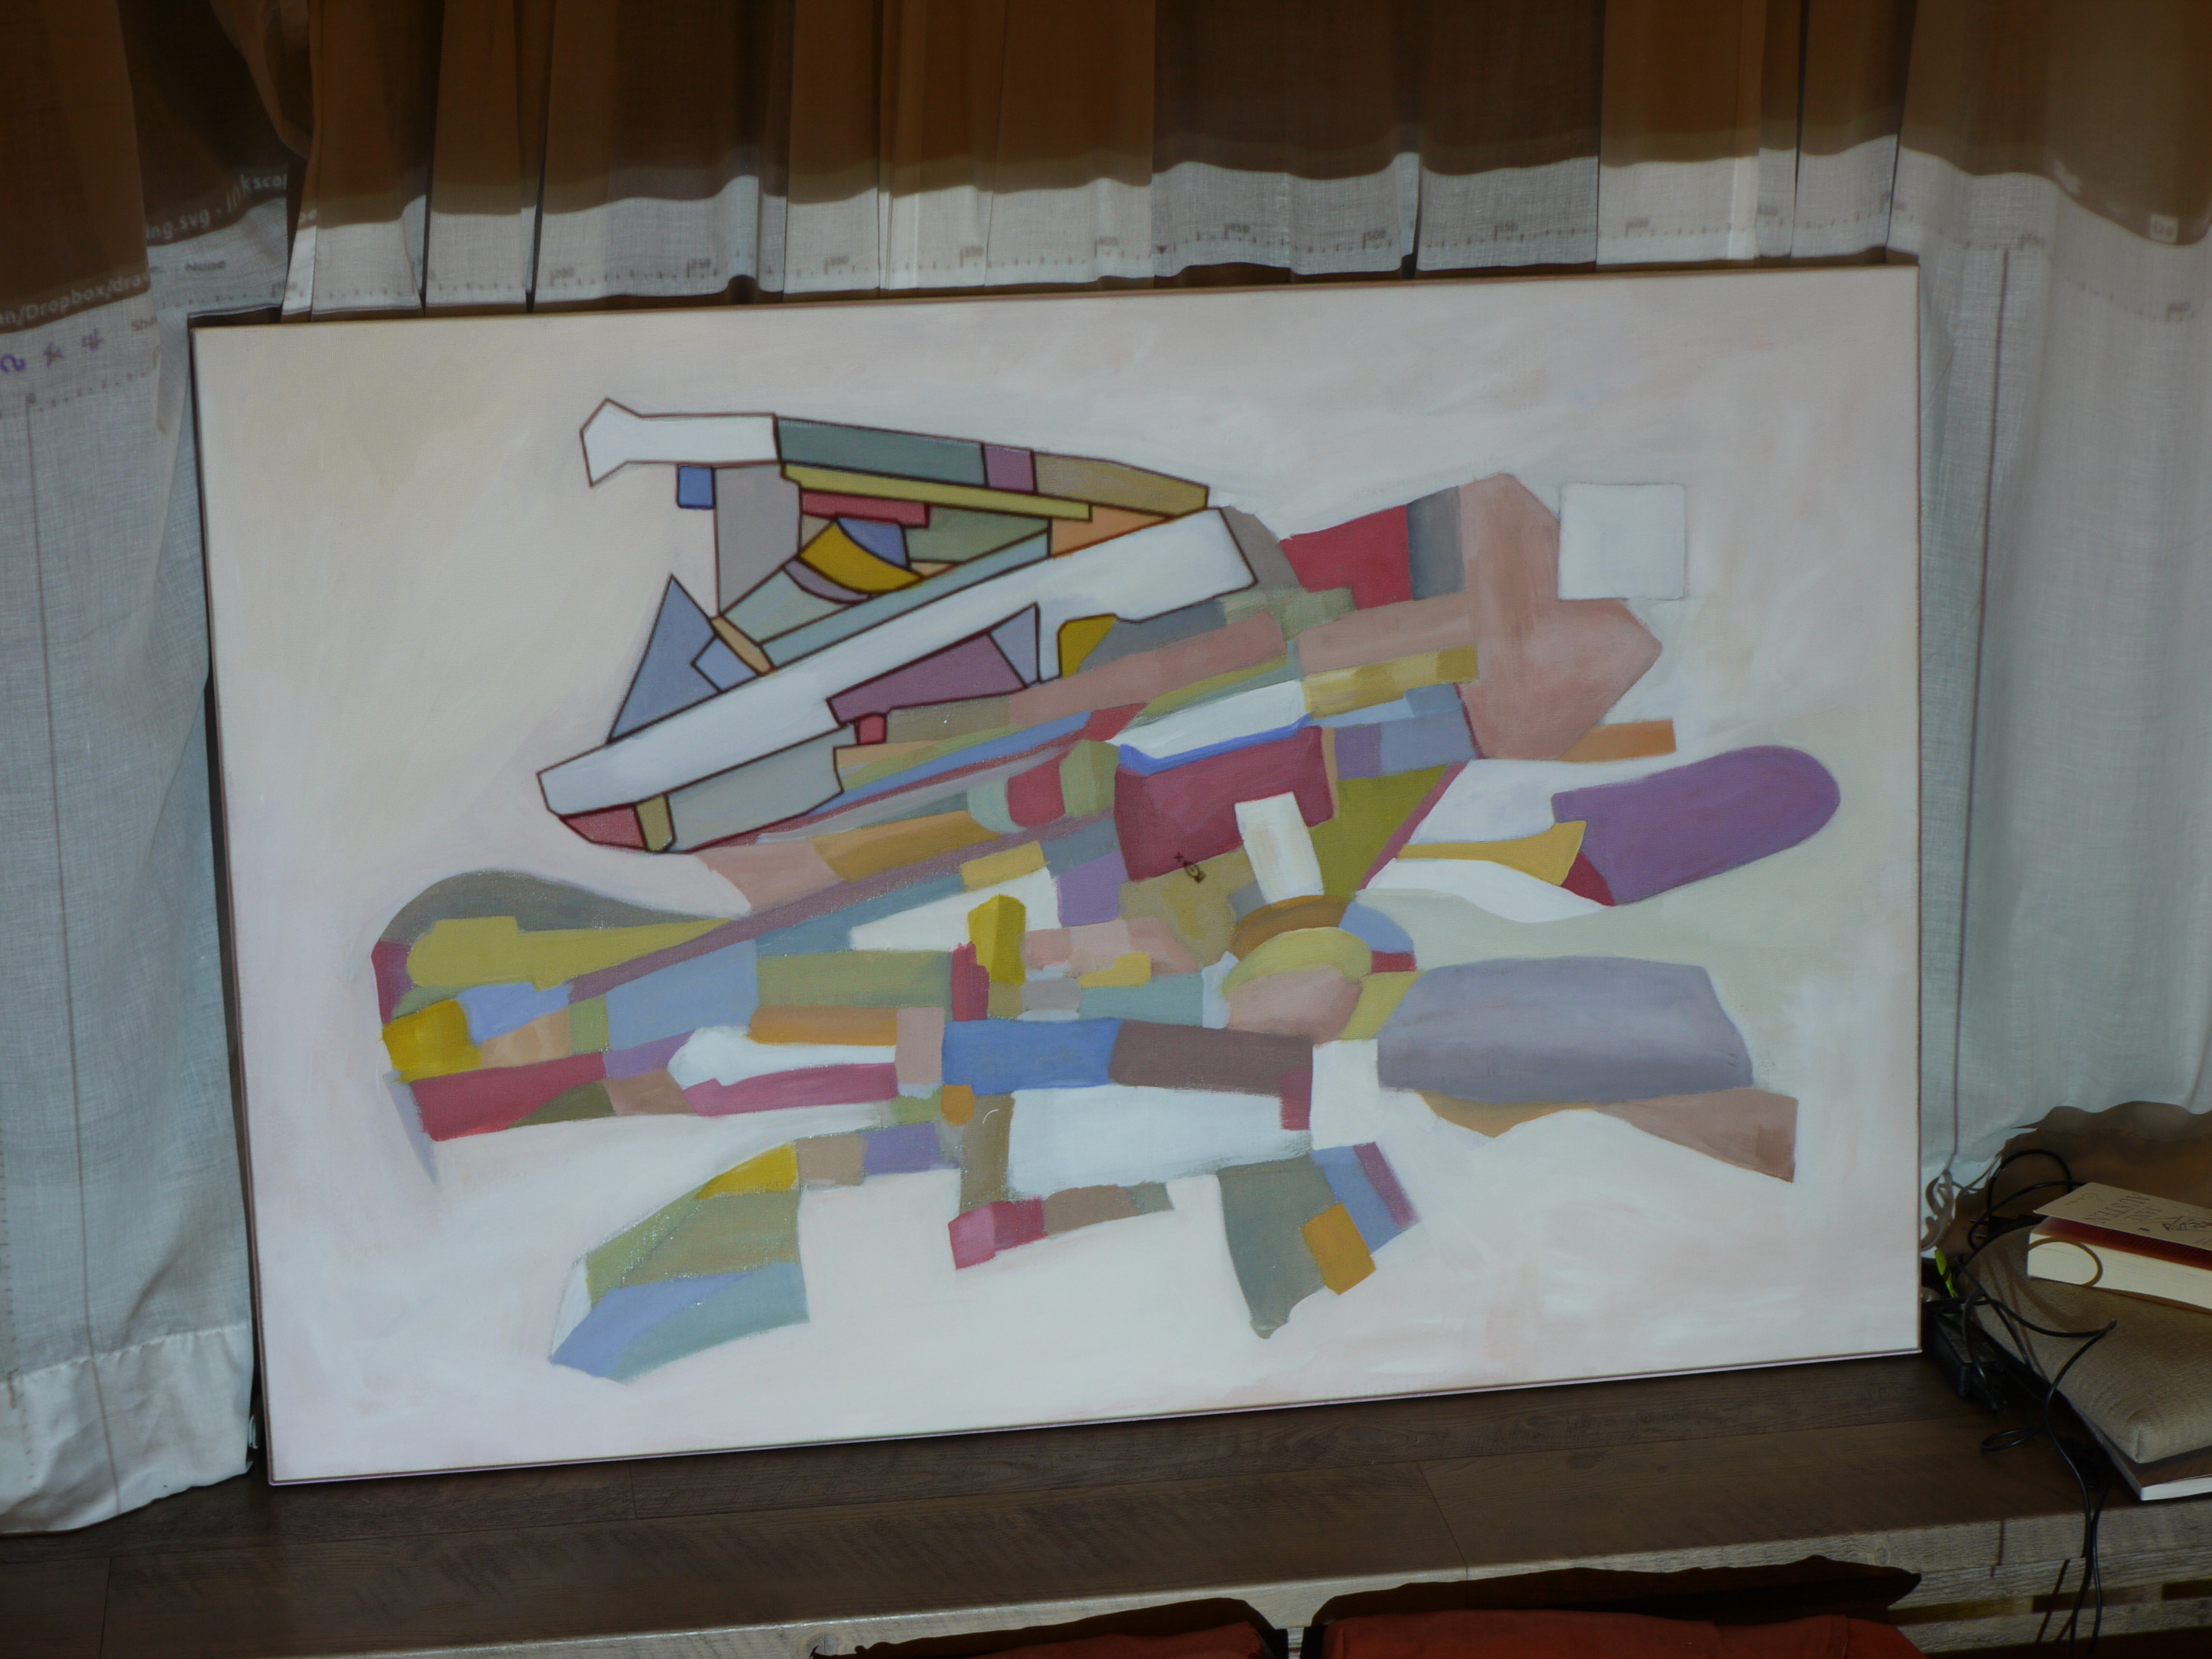
For the real-world part of this project, I painted a canvas with 133 abstract polygons with some inspiration of good old Kazimir Malevich. The areas’ outlines were transformed to a virtual clone in svg format. And then wrote an R script to calculate the area of each polygon and to normalize them.
Finally, the areas of the canvas had to be chosen so that the sum of their areas best matches the proportion for each task category in each minute. This combinatorial optimization riddle is known as the Knapsack problem in literature and obviously there is no other solution than to test every single combination, brute force. In order to compensate the lack of supercomputers at home, I randomly created seven groups from all the polygons. This way the combinations were reduced to 2 million per minute and per category. It took 32 hours for my computer to come up with the optimal solution for presenting the ambuzzador’s past in realtime. The maximal deviance between data and canvas is about 2% with a standard error of 0.087%.
The projection painting was done again in Processing using keystone library. The whole project took about 3 months. The source code is publicly available on github: https://github.com/sektionschef/10yearsbuzz
with special thanks to
- https://gist.github.com/ivanpike/5236688 - multiple surfaces for keystone library in processing
- http://de.wikihow.com/Die-Fl%C3%A4che-eines-Vielecks-berechnen - calculating areas of polygons
- http://stackoverflow.com/questions/21868326/r-scraping-web-with-xpathsapply - getting xml/svg in R
- http://forum.processing.org/two/ - all the open source communities